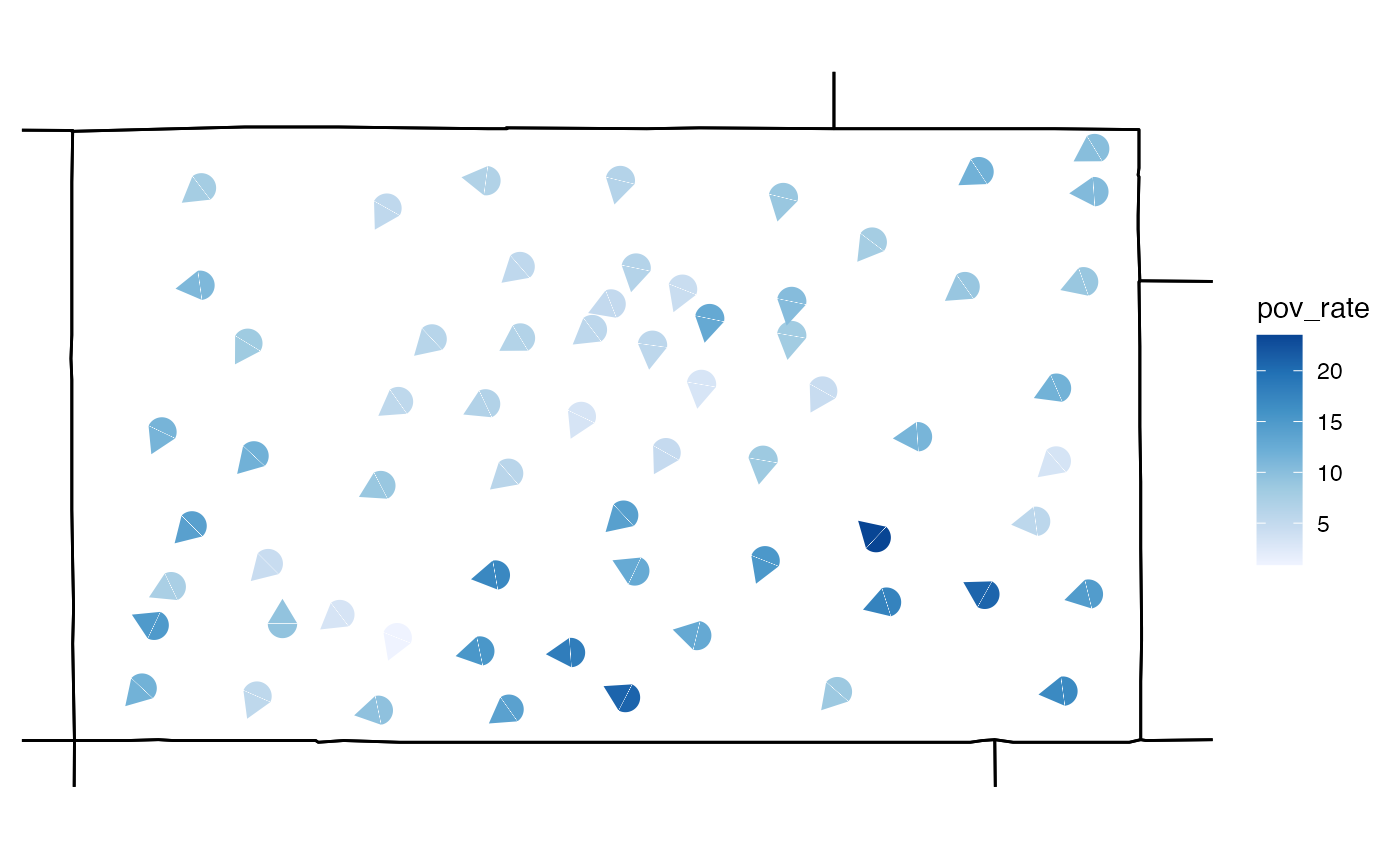
This function builds a map that visualises estimates and errors simultaneously with rotated glyphs.
build_gmap(
  data,
  geoData = NULL,
  id = NULL,
  size = 50,
  border = NULL,
  glyph = "icone",
  palette = "Blues",
  limits = NULL,
  max_error = NULL
)
Arguments
- data
A data frame with estimates and errors, formatted with
read.uv.- geoData
An sf or sp object.
- id
Name of the common column shared by the objects passed to
dataandgeoData. The estimates and errors in the data frame will be matched to the geographical regions through this column.- size
An integer between 1 and 100. Value controls the size of the glyphs.
- border
Name of geographical borders to be added to the map. It must be one of
county,france,italy,nz,state,usaorworld(see documentation formap_datafor more information). The borders will be refined to match latitute and longtidue coordinates from the geoData argument.- glyph
Name of glyph shape. Options include
iconeandsemi.- palette
Name of colour palette. It must be one of
Blues,Greens,Greys,Oranges,PurplesorReds(see documentation forscale_fill_distillerfor more information).- limits
Limits for the legend. Default is NULL, which takes the limits to be the range of the data.
- max_error
maximum error value. Default is NULL, which takes the maximum from the error given
Details
If an sf or sp object is used, glyphs will be plotted at region
centroids. If geoData remains NULL, glyphs will be plotted at
points on the map representing specific sites; in this case, the data frame
must include latitude and longitude coordinates in columns "long" and
"lat".
See also
Examples
data(us_data)
data(us_geo)
co_geo <- subset(us_geo, us_geo@data$STATE == "08")
us_data$GEO.id2 <- as.numeric(us_data$GEO.id2)
co_data <- subset(us_data, us_data$GEO.id2 > 8000 & us_data$GEO.id2 < 9000)
co_data <- read.uv(data = co_data, estimate = "pov_rate", error = "pov_moe")

# build a glyph map
map <- build_gmap(data = co_data, geoData = co_geo, id = "GEO_ID",
 size = 70, border = "state", glyph = "icone")
view(map)