This function links data and a colour palette. Numerical bounds are added to the 3 x 3 colour grid.
build_bkey(
  data,
  palette = "BlueYellow",
  terciles = FALSE,
  flipAxis = FALSE,
  expertR_est = NA,
  expertR_err = NA,
  bound = NULL,
  fontSize = 3,
  transparent = FALSE
)
Arguments
- data
A data frame.
- palette
Name of colour palette or character vector of hex colour codes created with
build_palettefunction. Colour palette names includeBlueYellow,CyanMagenta,BlueRedandGreenBlue.- terciles
A logical value. This provides the option to define numerical bounds for the colour key grid using terciles instead of equal intervals.
- flipAxis
A logical value. Whether to place the axis on the opposite sides or not.
- expertR_est
A vector consisting of the range of expert values for the estimate (Default: NA).
- expertR_err
A vector consisting of the range of expert values for the error (Default: NA).
- bound
A vector of eight elements representing the bounds for the estimate and error that will be used on the bivariate colour key. These can be created using the
findNboundsfunction.- fontSize
An integer value. Default is 3.
- transparent
A logical value. Option to make the key background transparent. Default value is FALSE.
Details
A key for the bivariate map is not automatically generated with
build_bmap and must be made using build_bkey. It
is important that the arguments passed to build_bkey match those
passed to build_bmap. The map and key can be viewed together
using attach_key.
If bound is NULL, the bounds for the legend will be computed from the data and expert bounds (if available) using the findNbound function. The argument bound should only be used if you want to make comparison against multiple maps. For that scenario, the user should use the findNbounds function to generate a bound for the larger set of data that wish to compare.
See also
Examples
data(us_data)
data(us_geo)
poverty <- read.uv(data = us_data, estimate = "pov_rate", error = "pov_moe")
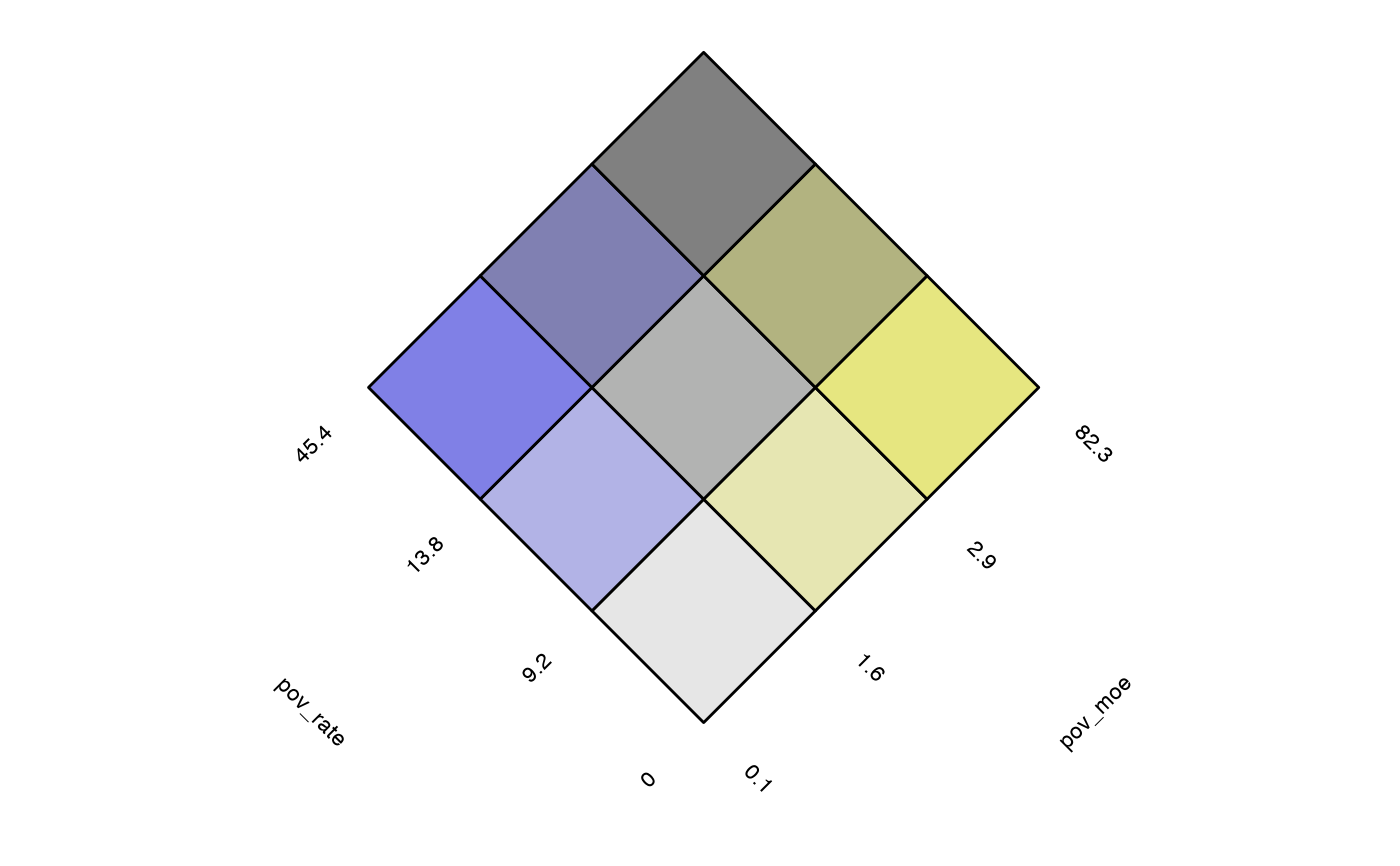
# use a prepared palette and terciles
key <- build_bkey(data = poverty, terciles = TRUE)
view(key)
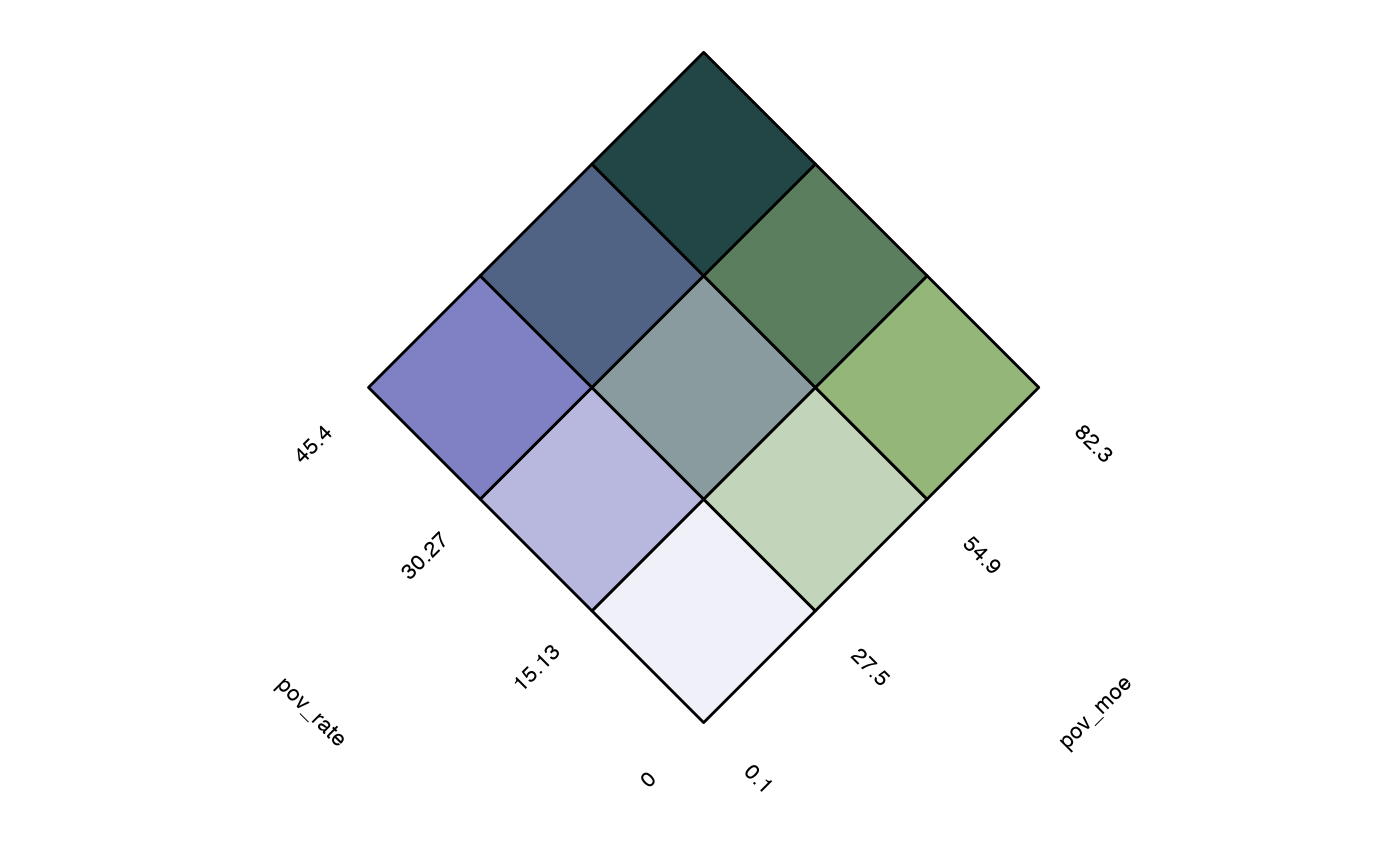
 # use a created palette
p <- build_palette(name = "usr", colrange =
list(colour = c("darkblue", "chartreuse4"), difC = c(3, 4)))
key <- build_bkey(data = poverty, palette = p)
view(key)
# use a created palette
p <- build_palette(name = "usr", colrange =
list(colour = c("darkblue", "chartreuse4"), difC = c(3, 4)))
key <- build_bkey(data = poverty, palette = p)
view(key)